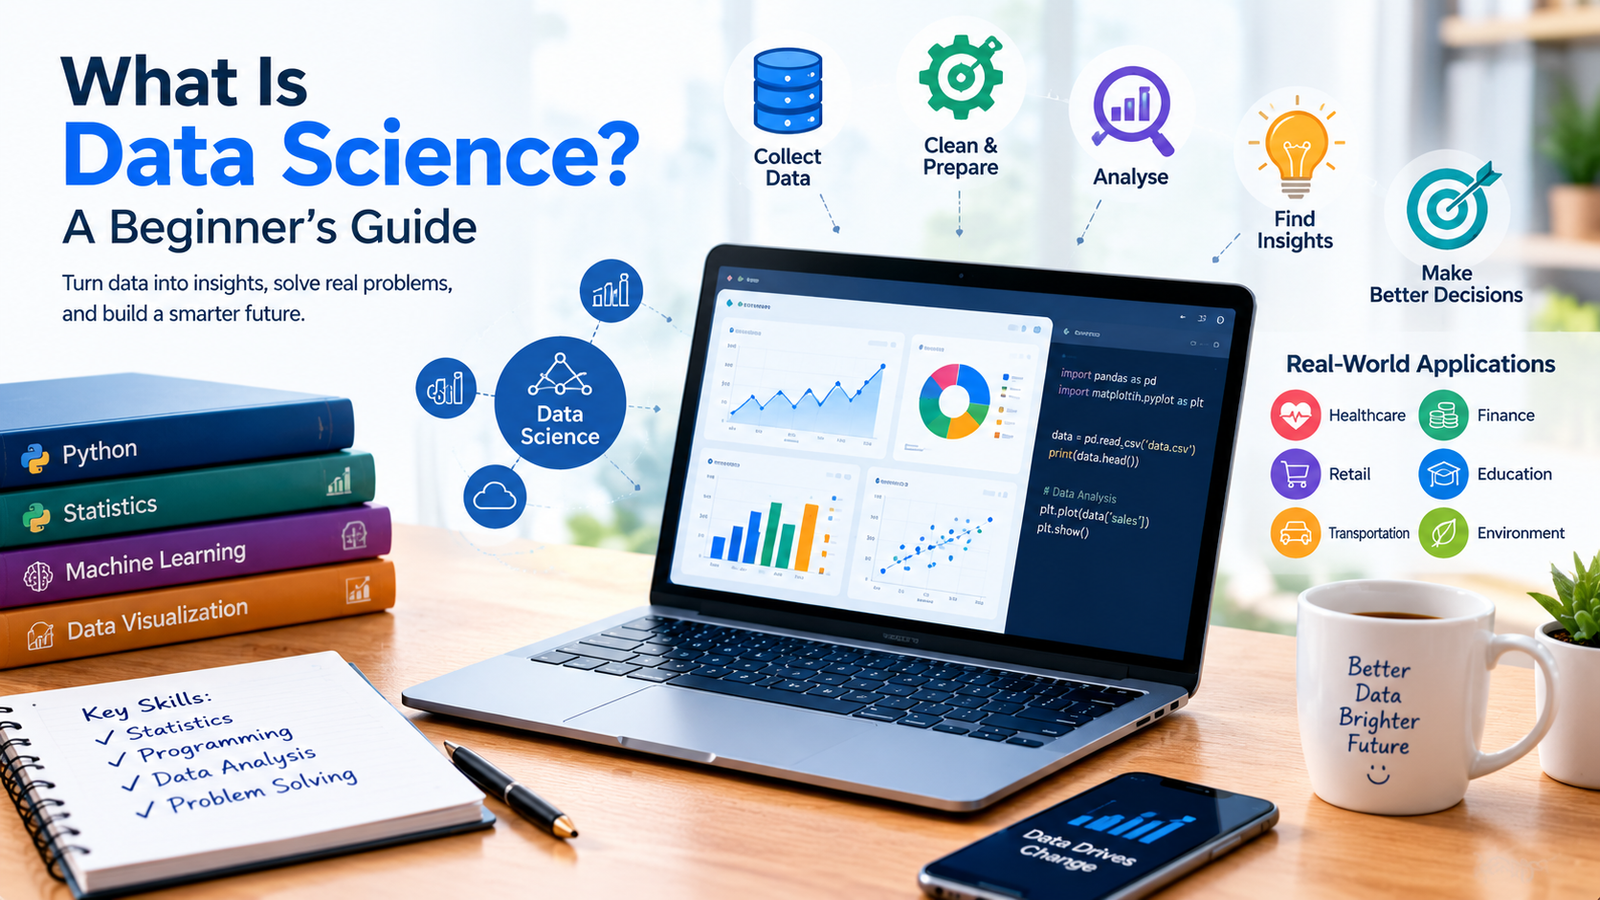
Introduction
Every day, people create enormous amounts of digital information. Online shopping platforms record purchases, businesses track sales, mobile applications collect usage statistics, and hospitals maintain patient records. But collecting information is only the first step. The real challenge is understanding what that information means and how it can help people make better decisions.
This is where data science becomes useful.
Data science is a field that combines statistics, programming, analytical thinking, and knowledge of a particular subject to discover useful information from data. It helps organisations identify patterns, understand customer behaviour, solve problems, and make decisions based on evidence rather than assumptions.
You do not need to be an expert mathematician or an experienced programmer to begin learning data science. Starting with basic concepts and practising with small datasets can help you build the skills required to understand this field.
In this guide, we will explain what data science is, how it works, which tools professionals use, where it is applied, and how beginners can start learning it step by step.
What Is Data Science?
Data science can be defined as a method of gathering, organising, analysing and interpreting data in order to find answers to questions and help in solving problems.
It brings together several areas of knowledge, including mathematics, statistics, computer programming, data visualisation, and domain expertise.
For example, an online store may want to understand why some products sell better during certain months. A data scientist can examine historical sales, compare seasonal patterns, and investigate whether prices, promotions, or customer preferences are associated with changes in demand.
The results can help the business plan its stock and marketing activities more effectively.
Data science is not limited to businesses. Researchers use it to study scientific questions, transport planners analyse traffic patterns, and environmental organisations examine changes in weather and pollution measurements.
The purpose is not simply to produce charts or calculate numbers. It is to turn data into useful evidence while recognising the limitations of the analysis.
How Does Data Science Work?
A data science project usually follows several stages. The exact process depends on the problem, the available information, and the results the organisation needs.
1. Understanding the Problem
Before collecting data, it is important to understand the question that needs an answer.
For example, a website owner might want to know why visitors leave a page without reading further. A retailer might want to understand which products are frequently purchased together.
A clear question helps determine what information is needed and which methods are appropriate.
Without a well-defined objective, a project can spend a great deal of time analysing information that does not help solve the original problem.
2. Collecting Data
Once the question is clear, the next step is to gather relevant information.
Data may come from spreadsheets, databases, surveys, application logs, sensors, public datasets, or other authorised sources.
For example, an online business might collect information about product prices, order dates, delivery times, and sales totals.
The quality of the collected data matters. If important information is missing or measurements are inaccurate, the analysis may produce misleading results.
Data collection should also respect privacy, permission requirements, and applicable laws.
3. Cleaning and Preparing Data
Raw data is rarely ready for analysis.
A spreadsheet might contain missing values, duplicate entries, inconsistent date formats, or spelling differences between categories.
Data cleaning involves identifying and addressing these problems. Preparation may also include converting values into consistent formats and combining information from different sources.
Imagine a sales spreadsheet in which the same city appears under three different spellings. If these entries are not standardised, the analysis may incorrectly treat them as separate locations.
Although data cleaning can be time-consuming, it is an essential part of producing reliable results.
4. Exploring the Data
After preparation, analysts explore the information to understand its structure and identify possible patterns.
They may calculate averages, compare categories, examine changes over time, and create charts.
For instance, a business might compare monthly sales to determine whether demand changes during particular periods.
Exploratory analysis can reveal unexpected results and help identify questions that deserve further investigation.
However, finding a pattern does not automatically explain why it exists. Additional evidence may be required to understand the underlying cause.
5. Applying Statistical or Machine Learning Methods
Depending on the problem, a data scientist may use statistical analysis, predictive modelling, or machine learning.
A statistical method may be utilized to determine the correlation between advertising expenditure and sales. A machine learning model can trained to classify customer support messages or forecast future demand.
Not every project requires advanced algorithms. Sometimes, a clear chart or a simple calculation provides the answer.
The method should match the problem, the available data, and the level of accuracy required.
6. Communicating the Results
The final stage is to explain what the analysis reveals.
Results may be presented through reports, dashboards, charts, or presentations.
A useful report explains the main findings, describes relevant limitations, and makes clear what conclusions the evidence supports.
For example, an analyst might discover that delivery delays are more common in certain areas. The report can help a business investigate whether staffing, transport routes, or other operational factors need attention.
Good communication matters because even an accurate analysis has limited value if decision-makers cannot understand it.
Data scientists work with different types of information
Data comes in different forms, and understanding these forms helps determine how to analyse it.
Structured Data
Structured data follows an organised format, often using rows and columns.
Examples include sales spreadsheets, customer order tables, and employee attendance records.
Because its structure is clearly defined, it can often be analysed using spreadsheets, SQL, and statistical tools.
Unstructured Data
Unstructured data does not fit neatly into a conventional table.
Examples include photographs, audio recordings, videos, emails, and many types of documents.
Working with this information may require specialised techniques, such as image processing, natural language processing, or machine learning.
Quantitative Data
Quantitative data represents numerical measurements or counts.
Examples include product prices, monthly revenue, temperature readings, and the number of visitors to a website.
Analysts can use mathematical methods to summarise these values and investigate patterns.
Qualitative Data
Qualitative data describes characteristics, experiences, or categories.
Examples include customer feedback, product reviews, interview responses, and descriptions of user experiences.
This information can help organisations understand opinions and identify common themes. Some qualitative information can also be converted into categories for further analysis.
Real-World Applications of Data Science
Data science is used across many industries because organisations need ways to understand information and make informed decisions.
1. Healthcare
Healthcare organisations generate information through medical records, laboratory tests, medical imaging, and research.
Data analysis can help researchers study health trends, evaluate treatments, and identify patterns across large datasets.
For example, researchers may examine anonymised health records to investigate whether certain factors are associated with particular outcomes.
The results must be interpreted carefully because medical data can be incomplete, biased, or affected by differences between patient groups.
Data science supports healthcare professionals, but analytical results should not replace appropriate clinical judgement.
2. Online Shopping and E-Commerce
Online retailers can use data science to understand how customers interact with products and services.
They may analyse search activity, purchases, product reviews, and browsing patterns to improve website navigation or plan inventory.
Recommendation systems are a familiar example. A shopping platform may suggest products based on previous purchases, product similarities, or patterns among customers.
These recommendations are not always accurate, and businesses must consider privacy and fairness when using customer information.
3. Banking and Financial Services
Financial institutions use data analysis to monitor transactions, evaluate risks, and understand changes in financial activity.
For example, a system may flag a transaction that differs significantly from a customer’s usual activity for further review.
Data science can also support financial forecasting and risk assessment.
However, automated systems can make mistakes. A suspicious transaction may be legitimate, while unusual activity may not always be detected. Human review and appropriate safeguards remain important.
4. Education
Schools, colleges, and online learning platforms can analyse student performance and engagement.
For example, an educational platform may examine which lessons learners revisit most frequently or where they commonly stop completing a course.
These findings can help educators improve course materials and identify areas where students may need additional support.
Data should be interpreted responsibly. A student’s performance can be influenced by many circumstances, and numerical results alone do not provide a complete picture of their abilities.
5. Transportation and Logistics
Transport companies deal with information about routes, delivery times, vehicle use, fuel consumption, and traffic conditions.
Data analysis can help identify common delays and compare the performance of different routes.
For instance, a delivery company might analyse historical delivery times to estimate how long certain journeys usually take.
Such estimates can support planning, although traffic, weather, road closures, and unexpected events can affect actual travel times.
6. Marketing and Digital Websites
Digital marketing produces information about website visits, search activity, advertising campaigns, and customer interactions.
Data analysts can compare campaign performance and examine which pages attract visitors or encourage enquiries.
For a website owner, analysing visitor behaviour may reveal that a particular article receives substantial traffic but has a high exit rate. This could be a reason to review the content, page design, or relevance of the information.
However, a high exit rate is not automatically a problem. A visitor may leave after finding exactly what they needed.
The key is to interpret metrics in the context of the website’s goals.
7. Agriculture and Environmental Research
Farmers and researchers can use data from weather stations, soil sensors, satellite imagery, and field observations.
These sources may help examine crop conditions, estimate water requirements, and study environmental changes.
For example, comparing soil moisture measurements with weather information can help a farmer understand how conditions vary across a field.
The usefulness of the analysis depends on accurate measurements and an understanding of local conditions.
Essential Skills for Learning Data Science
Beginners do not need to master every tool at once. Building a strong foundation is more useful than trying to learn everything immediately.
Statistics and Basic Mathematics
Statistics helps explain how data can be summarised and interpreted.
Start with concepts such as averages, percentages, variation, probability, and the difference between correlation and causation.
These ideas help you understand whether a result is meaningful and what conclusions can reasonably be drawn from it.
For example, two variables may change together without one directly causing the other. Recognising this distinction prevents misleading conclusions.
Programming
Programming allows analysts to process data, automate repetitive tasks, and build analytical workflows.
Python is a popular choice for beginners because it has a readable syntax and a broad ecosystem of data analysis libraries.
You can begin with variables, lists, conditions, loops, functions, and reading files.
You do not need to learn every programming concept before analysing your first dataset. Start with basic skills and apply them to small practical exercises.
Spreadsheet Skills
Spreadsheets are useful for organising data, performing calculations, filtering records, and creating simple charts.
Learning tools such as Microsoft Excel or Google Sheets can help you understand how datasets are structured.
Spreadsheet experience is also valuable because many organisations use spreadsheets for everyday reporting and analysis.
SQL and Databases
SQL is a language used to retrieve and manage information in relational databases.
Data science projects often require information stored across multiple tables. SQL can help filter records, combine tables, group results, and calculate summaries.
Learning basic queries is a practical step toward working with larger datasets.
Data Visualisation
Charts and dashboards help people understand patterns that may be difficult to see in raw tables.
For example, a line chart can show how sales change over time, while a bar chart can compare results between product categories.
Good visualisation should make information easier to understand rather than making simple results appear more complicated.
Critical Thinking
Technical skills alone are not enough.
A data scientist must ask whether the information is reliable, whether the analysis answers the original question, and whether other explanations could account for the results.
Critical thinking also involves recognising bias and explaining uncertainty.
These skills are useful even when working with small datasets and simple calculations.
Popular Tools Used in Data Science
Several tools help professionals organise, analyse, and present data.
Python
Python is widely used for data analysis, automation, visualisation, and machine learning.
Libraries such as pandas help organise tabular data, while NumPy supports numerical computing. Other libraries provide tools for charts and statistical modelling.
Python can be useful for beginners because the same language can support both basic analysis and more advanced projects.
R
R is a programming language designed for statistical computing and graphics.
It is used in statistical analysis, research, and data visualisation.
Python and R can both be valuable. The better choice depends on the project, the available resources, and the tools used by the team.
SQL
SQL is essential when working with data stored in relational databases.
It allows users to retrieve specific information and perform calculations directly within a database.
Even beginners who primarily use spreadsheets can benefit from understanding SQL.
Microsoft Excel and Google Sheets
Spreadsheet tools are suitable for many small and medium-sized tasks.
They can help users clean data, calculate summaries, build charts, and prepare reports without requiring a complete programming workflow.
They are often a practical starting point for learning data analysis.
Power BI and Tableau
Power BI and Tableau are tools used to create interactive dashboards and reports.
They help users present important metrics and allow decision-makers to explore information through filters and visualisations.
Their usefulness depends on the quality of the underlying data and the clarity of the report design.
Jupyter Notebook
Jupyter Notebook provides an environment where users can combine code, written explanations, calculations, and charts in one document.
It is particularly useful for learning and experimenting because the results of individual steps can be viewed alongside the code.
Data Science vs. Artificial Intelligence vs. Data Analytics
These terms are related, but they do not mean exactly the same thing.
Data science is a broad field that uses data, statistics, programming, and analytical methods to investigate questions and build solutions.
Data analytics focuses on examining data to understand performance, answer questions, and support decisions. It may involve reports, dashboards, statistical analysis, and comparisons.
Artificial intelligence (AI) refers to systems designed to perform tasks associated with capabilities such as recognising patterns, generating content, or making predictions.
The fields overlap. A data scientist may use AI techniques, while a data analyst may work with data produced by an AI system.
However, many data science projects do not require AI, and many analytics tasks can be completed using basic statistics and clear visualisations.
Understanding these differences can help beginners choose the skills most relevant to their interests.
Challenges and Limitations of Data Science
Data science can produce useful insights, but the process has several challenges.
Poor Data Quality
Incomplete, inconsistent, or inaccurate information can lead to unreliable results.
A sophisticated model cannot automatically correct every problem in its input data.
Analysts must understand where the information came from and how it was collected.
Bias in Data
Data may reflect historical inequalities, incomplete sampling, or decisions made during the collection process.
If these limitations are ignored, the resulting analysis may produce unfair or misleading outcomes.
For example, a model trained on information that does not represent the intended users may perform poorly for some groups.
Privacy and Security
Data can contain personal, financial, or confidential information.
Organisations should collect only what they need, protect stored information, restrict access, and follow relevant privacy requirements.
Removing names does not always guarantee anonymity, particularly when datasets contain several details that can be combined.
Misinterpreting Results
A pattern in the data does not always mean that one factor causes another.
Small datasets, unusual events, and inappropriate analytical methods can all lead to misleading conclusions.
Results should be checked against the original question and interpreted with suitable caution.
Keeping Skills Up to Date
Data tools and analytical methods continue to develop.
Learning the basics provides a foundation, but professionals may need to update their knowledge as software, business requirements, and methods change.
The most valuable habit is to keep practising and understand why a method works instead of simply memorising steps.
How to Start Learning Data Science as a Beginner
A simple learning plan can help you develop skills without feeling overwhelmed.
Step 1: Learn spreadsheet basics. Practise organising rows and columns, using formulas, filtering records, and creating charts.
Step 2: Study introductory statistics. Understand averages, percentages, distributions, and basic probability.
Step 3: Learn Python fundamentals. Practise variables, conditions, loops, functions, and working with files.
Step 4: Explore a data analysis library. Use pandas to load a small CSV file, inspect its columns, and calculate simple summaries.
Step 5: Create visualisations. Build charts that answer clear questions, such as which product category has the highest sales.
Step 6: Complete a small project. Choose a public dataset about weather, sports, transport, or retail. Ask a question, clean the information, analyse it, and write down your findings.
Step 7: Share your work. Create a clear report explaining the problem, the steps you took, the results, and the limitations of your analysis.
You can learn many of these skills using free educational resources and publicly available datasets. You do not need expensive software to begin practising.
Frequently Asked Questions
What is data science in simple words?
Data science is the process of using data, programming, and analytical methods to discover useful information and help solve problems.
Is data science difficult to learn?
Some topics require time and practice, particularly statistics and programming. Beginners can make steady progress by learning basic concepts first and applying them to small projects.
Do I need mathematics to study data science?
Basic mathematics and statistics are important. Advanced mathematics may be needed for certain specialised roles, but beginners can start with averages, percentages, probability, and introductory statistics.
Which programming language is best for beginners?
Python is a practical starting point because it has a broad range of data analysis tools and can be used for many different tasks. R is another useful option, particularly for statistical work.
Can I learn data science for free?
Yes. Free tutorials, documentation, public datasets, and open-source tools can help you learn the fundamentals. Consistent practice is more important than purchasing expensive software at the beginning.
What is the difference between data science and data analytics?
Data analytics usually focuses on examining data to answer specific questions and report findings. Data science covers a broader range of activities, including statistical modelling, programming, experimentation, and machine learning.
Where is data science used?
It is used in healthcare, finance, education, retail, marketing, transport, agriculture, scientific research, and many other areas.
Is data science a good career option?
It can be a useful career path for people who enjoy solving problems and working with information. Opportunities depend on practical skills, experience, communication ability, and the requirements of employers.
Conclusion
Data science helps people turn raw information into insights that can support better decisions. By combining statistics, programming, data preparation, and critical thinking, it can help organisations understand patterns and investigate real-world problems.
Its applications range from online shopping recommendations and financial monitoring to healthcare research and environmental analysis.
For beginners, the best way to start is to focus on the foundations. Learn how to organise data, understand basic statistics, practise programming, and communicate findings through simple charts and reports.
You do not need to master every tool before starting your first project. Choose a small dataset, ask a clear question, and work through the analysis step by step.
With consistent practice, you can build a solid understanding of data science and decide which areas you want to explore further.
Leave a Reply